In this part, I want to tell more about how exactly x86 processors store memory, and develop kind of intuition on how to work with memory when you’ll have to deal with it. For example, it can happen when you try to lookup some values stored in stack(i.e. when you need to look at function parameters). I presume you already know how pointers work. At the end, I’ll list instructions which are used the most in any program with simple crackme.
This is how binary file internals can be represented with ht tool on Linux, but you’ll see it often when working with other tools: 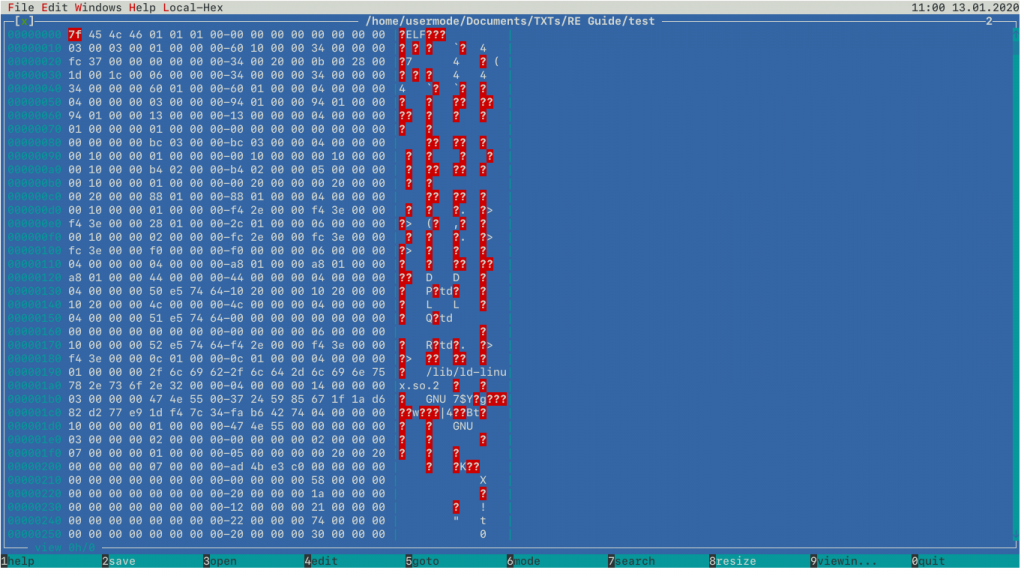
Left column shows base address for any particular byte located on the corresponding byte row. If you want to know absolute location of a byte in the whole file, you can add base address with byte offset ranging from 0 to 15. The middle column shows bytes themselves, and right column shows ASCII representation of bytes in the file.
What is Endianness?
Endianness is the order of bytes processor uses to store variables in memory. Normally all platforms are either low-endian or big-endian. The only platform I know which can support both endiannesses is ARM.
Suppose there is an instruction like MOV DWORD PTR [var], 0xDEADBEEF. var is located at address 00400000. So, after this instruction is executed, memory layout would be this:
00400000: 0xEF 0xBE 0xAD 0xDE .. .. .. ..
This is how little-endian values are stored, in reverse byte order. If x86 were big-endian, var would be stored this way:
00400000: 0xDE 0xAD 0xBE 0xEF .. .. .. ..
This is the same order as 0xDEADBEEF is written. Again, EF -> BE -> AD -> DE is little-endian format, while DE -> AD -> BE -> EF is big-endian.
For some vague reason, the engineers who designed first Intel microprocessors decided little-endian format is best for them, and subsequent Intel processors were forced to follow this design to avoid compatibility issues. Actually, this is not the only strange thing Intel decided to do. Nowadays every Intel(and AMD) processor contains a lot of legacy features, like real mode, segmentation, old x87 instructions, and others which are not used by compilers. Though these things can be reasoned to provide backward compatibility(Intel once decided to produce processor series without backward support called Itanium, and failed), there are very strange things about those chips like A20 line and a lot of bugs in instructions on Core 2 Duo processors. The latter caused a little outrage to OpenBSD project leader. Also, there were introduced Spectrum and Meltdown attack vectors 3 years ago, which involve exploiting flaw in processor speculation mechanism. So, x86 architecture doesn’t just look old, it might also be insecure.
Unsigned vs Signed
Actually, you are supposed to know it already as most programming languages(even those not so low-level as C/C++, like Java) give you the option to declare either signed or unsigned variable. Anyway, I will explain the difference briefly.
Unsigned number can contain only positive values, signed numbers can be both positive or negative. But signed number’s range is less than that of unsigned numbers.
For x86 platforms, C/C++ int type is signed by default, and contains 4 bytes of memory. Any int variable fits in range between -2,147,483,648(2^31) and 2,147,483,647(2^31 - 1). 4 bytes is 32 bits, and every such bit is used to store number’s value. But in case of signed numbers, the most significant bit is used to store variable’s sign: 0 means positive value, 1 means negative. This is why it is 2^31, not 32. -1 is there because zero is also a number.
Unsigned numbers use the most significant bit to store value, not whether number is positive or negative. unsigned int type is ranged between 0 and 4,294,967,295 (2^32 - 1).
Remember, processor doesn’t see difference between signed and unsigned types, from its viewpoint it is merely byte sequences. It is only instructions which operate on number’s value can tell you whether the number is signed or not. There are IMUL and MUL instructions described as “Signed Multiply” and “Unsigned Multiply” respectively, it means every of them produces either signed number or unsigned one. A lot of information belonging to the program is erased during compilation from source code, if you want to know program’s aspects you have to reverse engineer it.
How Call Stack Works
Memory stack, or call stack, is a very special kind of memory. Program uses this data to control execution flow, store arguments and local variables, and call functions. Every process running on computer has its own stack.
There are 2 registers on x86 platform which control the stack: EBP and ESP. ESP is the stack pointer, it stores the value of the top of the stack, EBP is the pointer to stack frame. Stack frame is mechanism to manage access to program’s memory. Every function called in the program has its own stack frame. It consists of arguments the function was called with by caller function(the function which was called is callee), return address of the instruction where execution flow will be resumed on after callee has exited, and local variables allocated by callee itself.
Stack is filled with values by PUSH and POP instructions. PUSH instruction decrements ESP by operand size, and puts operand at memory address contained in ESP(top of stack). POP instruction does everyting in inverse order: it moves memory unit of operand’s size at ESP to operand, and increments ESP by operand size, POPping the value at top of the stack to instruction operand. Depending on computer architecture(whether it is x86 or x86_64) and OS, default stack unit’s size used by PUSH and POP is either 4 bytes for 32-bit computers, or 8 bytes for 64-bit computers, for any program generated by compiler for those platforms. For x86_64 processors, RSP and RBP are used instead of 32-bit registers.
Stack memory can also be allocated by substracting number of bytes to allocate from ESP. This method is similar to how PUSH works, except this one is more versatile. To deallocate them, program can add the same number of bytes to ESP. This works as POP does. For the following assembly code executed in 32-bit environment:
...
PUSH EAX
SUB ESP, 0xF0
PUSH EBX
ADD ESP, 0xF8
...
adding 248 to ESP purges all the memory set up by code above, and restores ESP to its previous state, because it compensates 8 bytes allocated by two PUSH instructions, and 240 bytes of SUB instruction.
Stack can either grow down, or grow up. When stack grows up, program frees up stack space, making ESP(top of the stack) “grow” to higher stack addresses. When stack grows down, stack expands in memory to allocate variables, while ESP “grows” to lower addresses. Unfortunately, this kind of terminology is very vague and counterintuitive, due to approach used by Intel engineers I mentioned earlier. It would be much easier to expect stack grow up when it allocates variables inside it, but not vice versa. There’s also issue related to what we should consider the top of the stack: is it where stack’s highest(biggest) or lowest(smallest) address is located? According to Intel documentation, the top is always placed where ESP is, so this is where lowest address is(not zero, which is the lowest possible address).
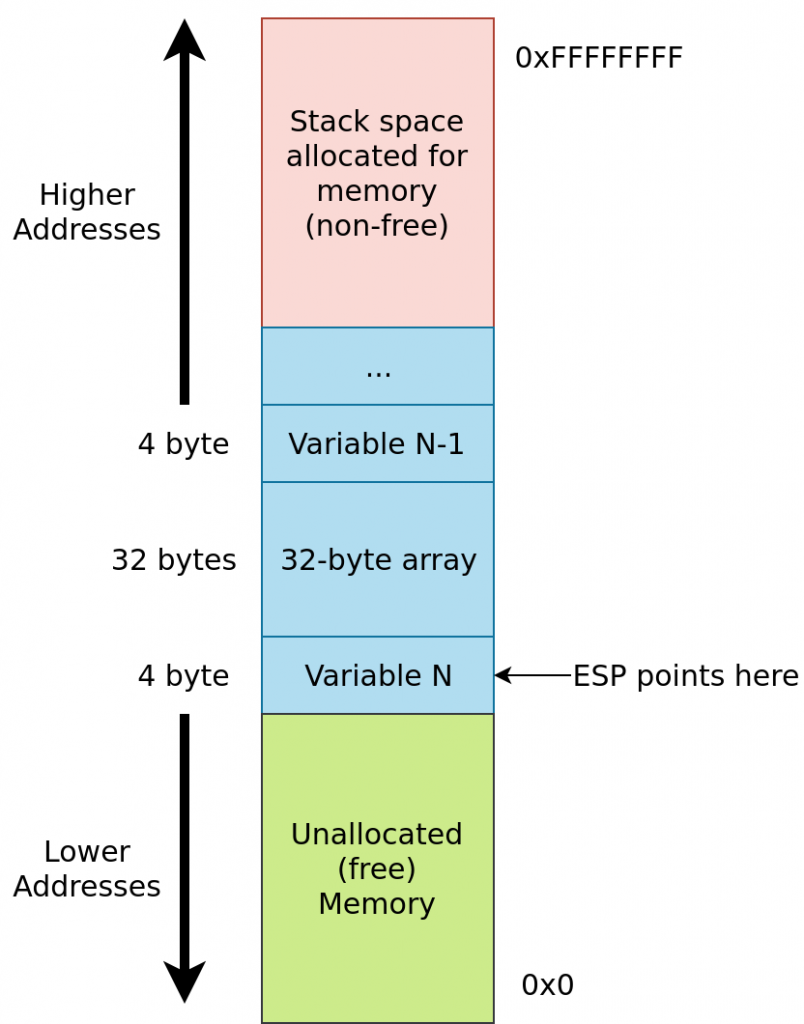
Assuming process' stack exists on 32-bit platform. ESP always points to the last allocated memory block
I want to show how stack functions and what it stores with simple C program:
#include <stdio.h>

int f(char a, int b){
     printf("%c %d\n", a, b);
}

int main(){
     char a = 'a';
     int b = 27;
     f(a, b);
}
This is disassembly of main() and f() functions produced by objdump: 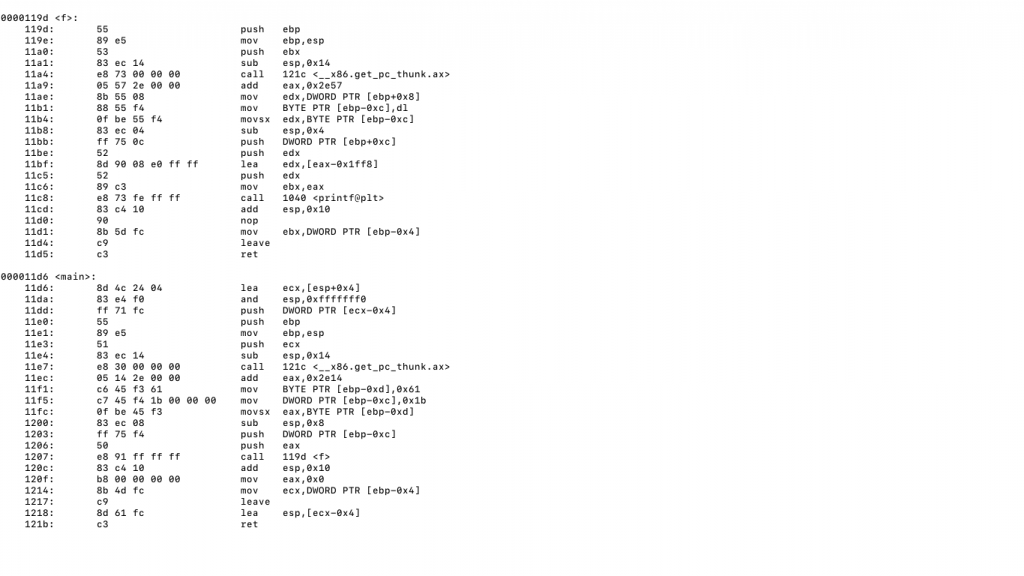
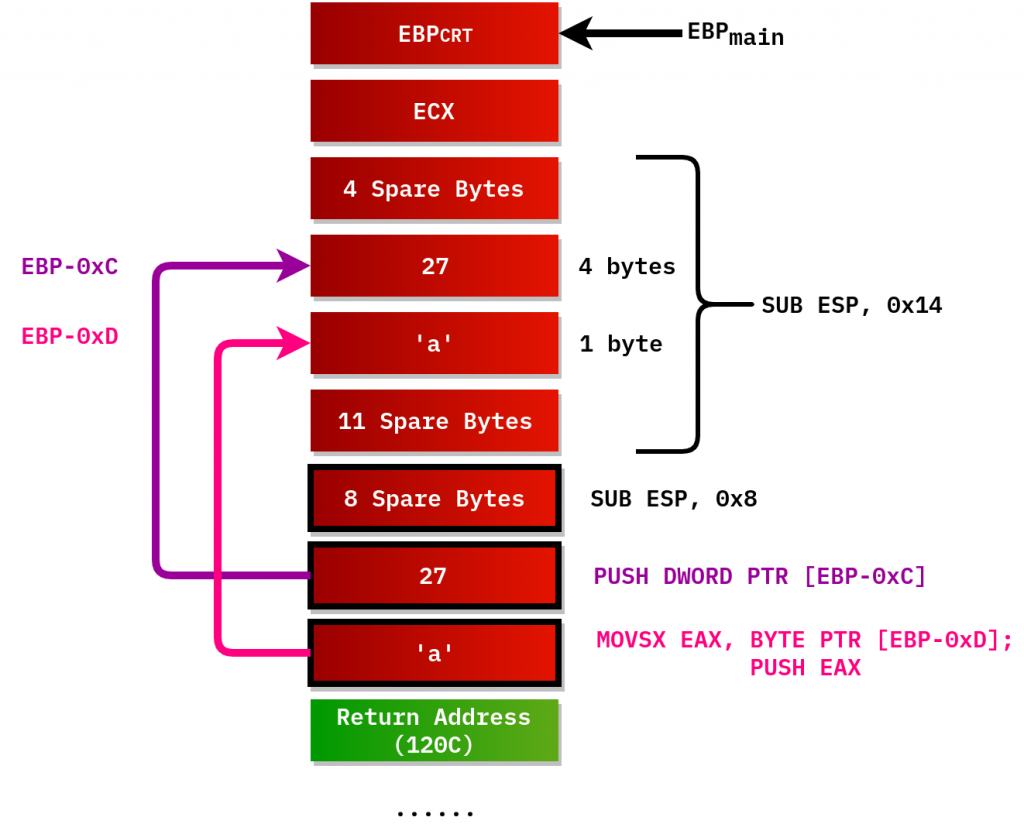
I made the diagram describing what items stack would contain for main() just after f() has been called:
The first piece of code we should be concerned of is 2 instructions at function offsets 11E0 and 11E1:
PUSH EBP
MOV EBP, ESP
This code sequence is called function prologue. It saves old frame pointer of caller function in stack(PUSH EBP), and sets up the new frame pointer by rewriting EBP with ESP contents. ESP refers to the stack item containing old frame pointer, so will EBP after 2nd instruction gets executed. EBP register is used to address local variables and function’s arguments, as we will see later. Instructions using EBP provide offsets to such stack items to access them.
Did you notice the EBP block is CRT-marked? CRT stands for C Runtime, this is what any OS implement nowadays. Right before main() function is called, OS creates the process and initializes C Runtime. EBP can be initialized as well, so before main() is called, EBP can store its own value.
MOVs at 11F1 and 11F5 allocate char and int variables. 11FC places ‘a’ to AL and zeroes out other bits in EAX. After that, program pushes arguments for f() on the stack and calls it. After f() returns, 120C deallocates 16 bytes of stack memory(they have black frames on the diagram). LEAVE instruction is the synonym for:
MOV ESP, EBP
POP EBP
With RET instruction they compose function epilogue. It reverses what function prologue did. It restores stack pointer to EBP stack item, and then pops it to EBP register. RET returns control to caller function by popping stack item at ESP to EIP.
You can see the program makes 2 pushes before calling f(). It is done according to x86 ABI(Application Binary Interface), I’ll tell more about it in next post. Briefly, for 32-bit binaries all functions should take their parameters pushed onto the stack in reverse order of function prototype.
Now let’s go back to f():

After f() is called, there are 2 arguments(blue blocks) on the stack made by main(), and return address where main() should resume execution after f() is done.
CALL instruction at 11A4 is not the same as normal function call, because its function was generated by compiler itself. It only fits in 2 lines:
MOV EAX, [ESP]
RET
This function loads EAX with dword at ESP. 11BF loads EDX with format string used by printf() by addressing EAX. Sometimes compiler uses registers such as EAX to address (global/constant/static) memory variables, it looks a bit similar as what EBP does. Though we didn’t explicitly declare format string as a char* variable, we used it in f(), compiler deemed it necessary to allocate it within program’s executable. Compiler thinks of it as static local variable, because it exists every time f() is called.
11B1 allocates ‘a’ as local variable, 11BB pushes 27 as 3rd argument to printf(), 11BE pushes ‘a’, 11C5 pushes format string. 11C8 calls printf() and pushes return address(next address in program) to continue execution after printf(). 11CD deallocates black-framed diagram blocks. After this, function epilogue ends up f().
Finally, this is what stack layout in f() function looks like, before exiting it.

You can compare it to the diagram above. The first address is the value of ESP, so the lower you go in this listing, the higher is the address in stack. This is because x86 stack grows upside down. Remember what I showed previously how x86 stack generally looks, and imagine as if you stood right at ESP and looked at higher stack addresses, this is what you would see.
You can see I didn’t tell what a lot of instructions do in that program. In fact, they didn’t have much meaning in the program. I compiled that program with gcc without optimization flags. When I compiled it with code size optimization flag(-Os), the output looked much clearer than it was originally. For example, all of those instructions allocating “spare” stack bubbles were gone.
But it often turns out, you don’t have to understand everything that the program does, you have to focus on what really matters.
Common Instructions
I recommend you to learn them, these are most common instructions in all programs compiled for x86/x86_64 architectures. Please note that some instructions, whether listed here or not, change status flags in EFLAGS. If you don’t understand something or want to know more, read Intel documentation. All instructions listed here take 2 operands, unless stated otherwise.
And here is the crackme I made, you have to type in any good number(there are several of them) to pass it: Crackme. Try to look at it and reverse it with any tool I mentioned so far(Ghidra, ht, objdump), if you have difficulties, you can use debugger(gdb). This is for Linux systems only, if you use Windows machine and you want to crack it, you have to use Linux virtual machine. Sorry. It doesn’t mean I am not interested in Windows systems, though.
Please leave your comment below.